Having good control of blood sugars is important to prevent complications of diabetes. We also know that having higher blood sugars increase the risk of infections in general. In the heart of the COVID-19 pandemic, is is perhaps more important than ever to have good control of blood sugars.
Traditionally, we follow a blood test called the hemoglobin A1C as an indicator of diabetes control. It provides a reflection of the blood sugar control over the last 3 months. However, it tells us nothing about whether sugars are variable (fluctuating between high and low), or stable. It is important to know if sugars are fluctuating, because low blood sugars can be imminently dangerous, and variability in blood sugars is associated with an increased risk of diabetes complications. Also, as blogged previously, the A1C is not always accurate.
Thus, there is now a new metric in town called Time In Range, which complements the A1C, to give information about variability in blood sugars.
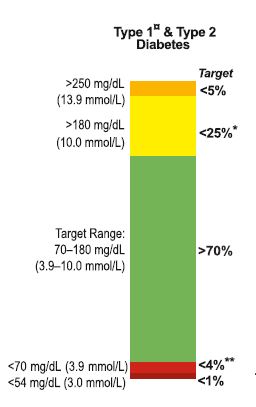
Time In Range data is available for people who use continuous glucose monitors (Freestyle Libre, Dexcom, or Medtronic in Canada). These monitors provide a huge amount of rich data, which can seem a little overwhelming at times. The Time In Range graph (which I like to call the Technicolor Tower) provides a very nice snapshot showing what percent of sugars are in target, what percent are low, and what percent are high.
An international consensus paper was published in Diabetes Care in 2019 to set standard goals for what we should be aiming to achieve with Time In Range. For most patients with type 2 or type 1 diabetes, the goal is to be in the target range of 3.9-10 mmol/L (green in the Technicolor Tower) at least 70% of the time, because this corresponds with an A1c of about 7.0% (which is the target A1C for most people with diabetes). And as always, the most important thing is to have as little low blood sugars (red in the Tower) as possible.
Previous data have demonstrated that when there is 10% less time in range, there is a 64% increase in risk of progression of diabetic eye disease, and a 40% increase in the risk of developing microalbuminuria (protein in the urine, which is a marker of diabetic kidney disease). We also know that every 10% increase in Time In Range corresponds to a decrease in A1C of 0.5-0.8% (reflecting better diabetes control).
So the goals for your Technicolor Tower are to have as little red as possible (ideally none), and to paint as much of it green as possible. Your diabetes care team can help you analyze your data and determine how best to adjust your diabetes treatments to reach these goals.
Disclaimer: I receive honoraria as a continuing medical education speaker and consultant from the makers of the continuous glucose monitors: Freestyle Libre (Abbott), Dexcom, and Medtronic.
Share this blog post using your favorite social media link below!
Follow me on twitter! @drsuepedersen
www.drsue.ca © 2020


